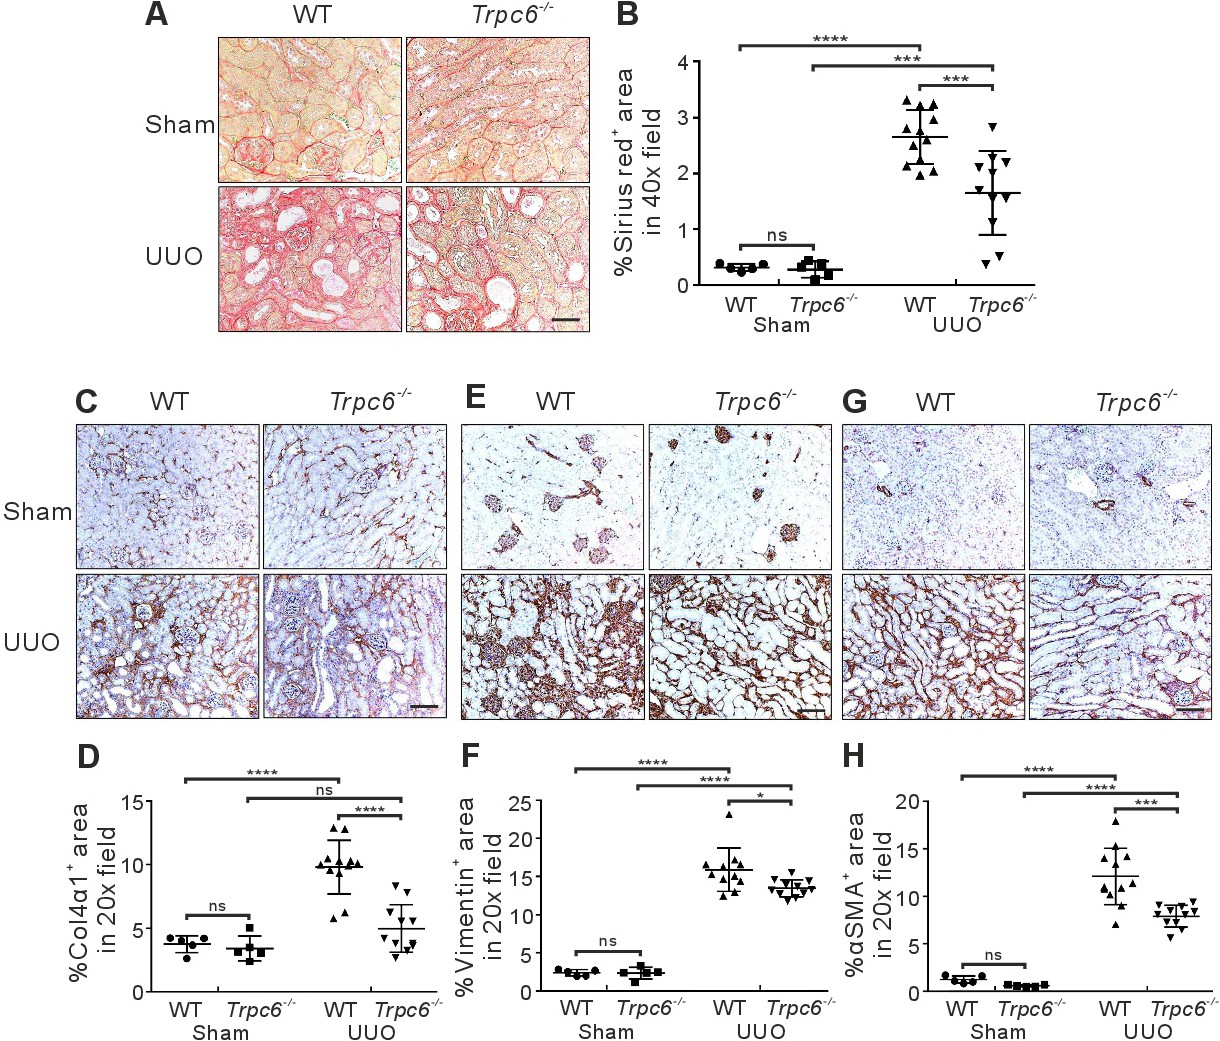
Fig. 5. Expression of fibrosis markers. (A) Sirius red (SR) staining (40x, Scale bar: 50 μm). (B) Quantification of the SR positive areas. (C) Collagen type 4, alpha 1 (Col4α1) antibody staining: fibrosis marker (20x, Scale bar: 100 μm). (D) Quantification of the Col4α1 positive areas. (E) Vimentin antibody staining: mesenchymal marker (20x, Scale bar: 100 μm. (F) Quantification of the vimentin positive areas. (G) Alpha smooth muscle actin (αSMA) antibody staining: myofibroblast marker (20x, Scale bar: 100 μm). (H) Quantification of the αSMA positive areas. Wild type (WT) and Trpc6-/- sham groups included n=5 kidney samples each. WT and Trpc6-/- UUO-treated groups encompassed n=12 (WT) and n=11 (Trpc6-/-) kidney samples. All quantification data are means ± SD. ns p>0.05, *p<0.05, ***p<0.001 and ****p<0.0001. ns, not significant.